Monitoring Message Requests
Note: This functionality is only available for OPERA versions 5.0+.
If the Access Point Utility Service is running, the OEDS Request Log Summary screen allows you to monitor each request through OPERA ADS, GDS, OPERA Web Suite, and User Interface. To access the OEDS Request Log Summary screen, select Setup > Configuration > Channels > Monitoring.
Date Options. Make a selection of either the Daily, Range, or Comparison option buttons if you want to search for a date, a range of dates (up to one week), or to compare two different dates.
Date. Select the first date to be included in the search.
Date2. The second date is used when the Range or Comparison date options are used. You must enter the second date to be included in the query.
Channel. Select the channel from the list of values. This field is mandatory.
Hour. Select the hour the message was sent, or leave this field blank to include all times.
Message Type. Select the message type from the list of values, or leave this field blank to include all message types. The following message types are available: ACTIVITY, AVAILABILITY, BROCHURE, GUEST SERVICES, INFORMATION, MEETING ROOM, MEMBERSHIP, NAME, RESERVATION, RESV ADVANCED, SECURITY, STAYHISTORY, and UNITOWNERS.
Method. Select the method of the message request, or leave this field blank to include all messages.
Date. The date of the message request.
Hr. The hour of the message request.
Type. The message type.
OWS Scs. The number of successful messages.
OWS Fail. The number of failed messages.
OWS Time. The total time it took to send the message.
Run the following services:
Application Parameters
Activate the following application parameter:
Tables
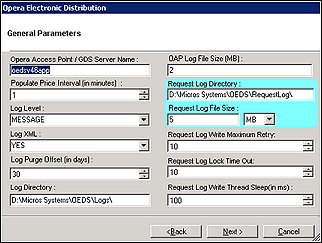
Request Log Directory and Request Log File Size

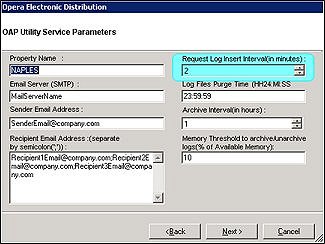
Request Log Insert Interval

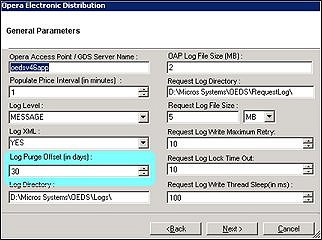
Log Purge Offset

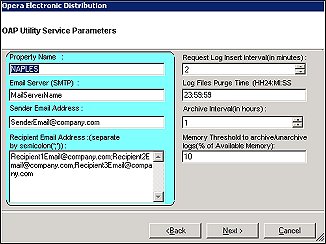
Request Log Email parameters:

|
See Also |