
OBI UI Overview
From the OPERA Single Sign-on Screen when you select the OBI module button (available when OPB_<version number> OBI Enterprise or OPI_BUIP_<version number> OBI Standard is active) or select the S&C Advanced Reporting module button (available when the OPS_SAREP S&C <version number> and ORO_<version number> Oracle BI SE-one User Interface license is active) the respective BI application opens. Within S&C and SFA you can also access Sales and Catering Advanced Reporting from Miscellaneous>S&C Advanced Reporting when BI permissions have been granted.
Note: This topic provides an overview of the BI User Interface (UI). For more detailed information about the OBI UI, refer to the Oracle Business Intelligence Documentation that is incorporated in the OBI application or on the Oracle web site: www.oracle.com.
The first screen that appears is My Dashboard. Unless you have selected a report to display on the main dashboard, it will be empty, as in the example below. If you want a report to display that would provide immediate insight when you open BI, select the Click here link where you will be able to drag and drop existing content/report to My Dashboard.
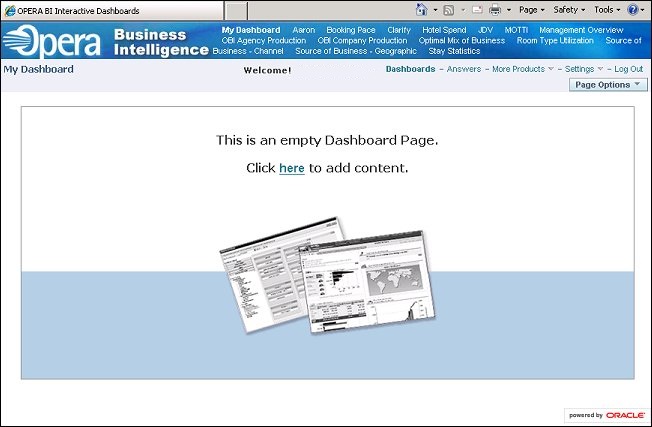
The OBI UI is divided into several main sections (depending on your version of OBI).
![]()
![]()

![]()
![]()
![]()
![]()
Each section is illustrated in more detail below.
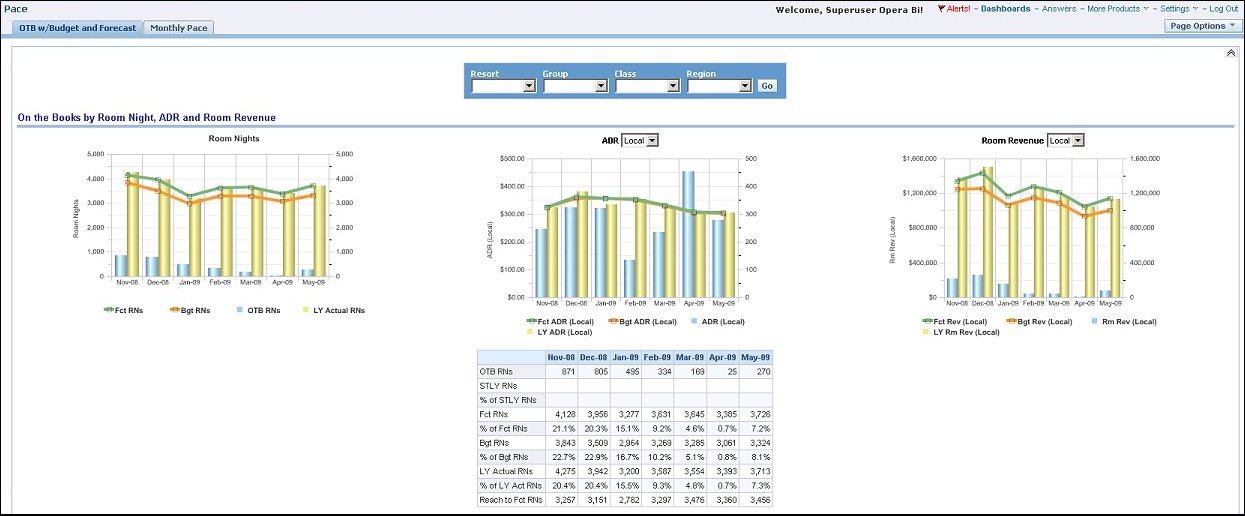
The following is an example of a user-created Dashboard: "Pace - OTB w/ Budget and Forecast." Dashboards are interactive where the user can select different filters and drill down for more detail.
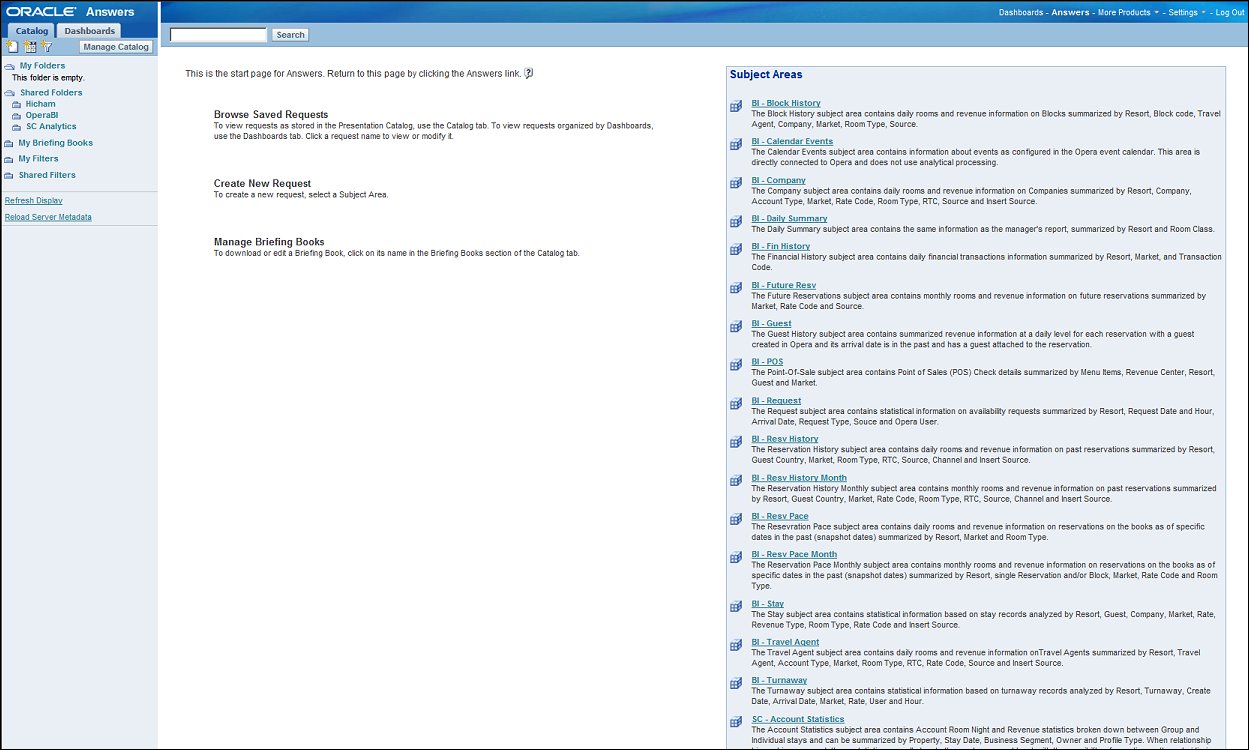
The Answers section contains information for working with requests for data analysis and reports.
You can select and interact with all the options to present and visualize the OPERA data in charts, pivot tables, and reports for analysis. You can save, organize, and share the results. Requests that you create with Answers can be saved in the Catalog and integrated into any Dashboard. Results can be enhanced through charting, result layout, calculation, and drill down features.
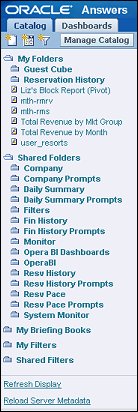
The Catalog selection pane is where you save your reports, either in My Folders or in Shared Folders (if you want to give access to the reports to external users).
Under the Catalog tab are three icons:
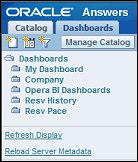
This tab of the selection pane is where the user-created dashboards are saved.
Under the Dashboards tab are three icons:
This is where you can view and change permissions for users to the different parts of a report as well as edit and reorganize the Catalog.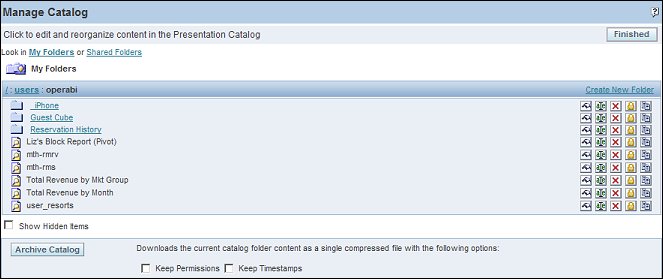
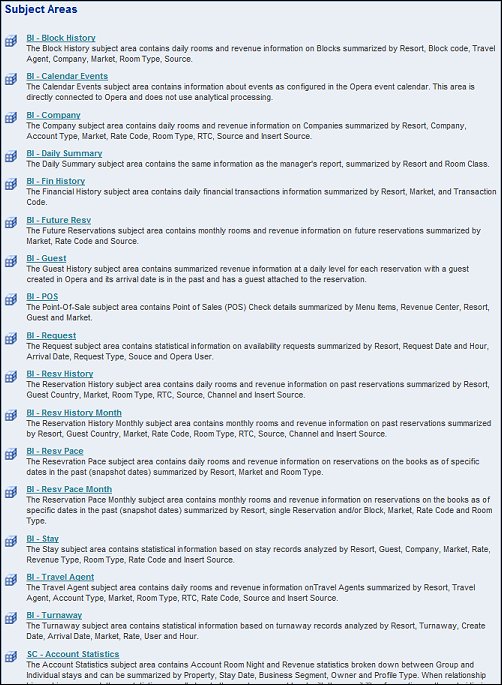
On the right-side of the screen, in Subject Areas, are the available OPERA data cubes (in S&C Advanced Reporting contains OLTP groups of information). You select the subject area for which you want Answers (reports). For example, if you select BI - Block History, the selection pane on the left-side of the screen changes to display a list of types of information you can select to create a report for that subject area. See Columns, next.
Note: For more information on OBI Subject Areas, see OBI Subject Areas Overview. For more information on the S&C Advanced Reporting Subject Areas, see S&C Advanced Reporting Subject Areas.
When a subject area is selected, such as Block History, the Columns, Measures, and Filters that are available for inclusion in your report for analysis appear in the selection pane. One of the features of the report is that you can create columns that compare data for two different times or dates or ranges of times and dates.
Note: In OBIEE OPB_<version number> OBI Enterprise (Multiple Properties), when users hover the mouse cursor over any attribute or measure of a Subject Area, a tooltip displays that describes the column. If applicable, a description of how the values are calculated is also included.
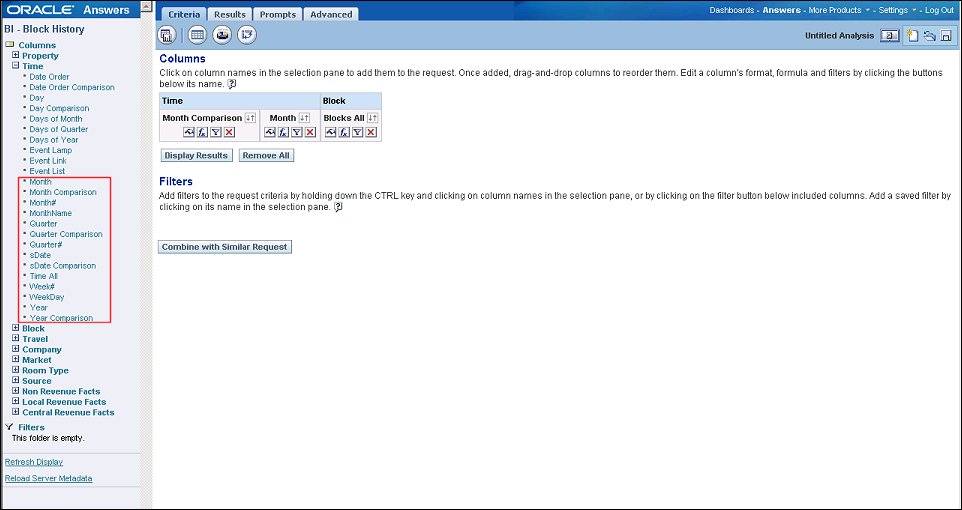
When a subject area is selected to create a new request, or modify a saved request, the workspace displays the tabs for working with the request. Each tab contains on-screen information and buttons to help you create, access, and manage requests. On each tab, you can pause your pointer over each button for a description of what it does.
One of the popular features in Delivers is iBots (available in OPB_<version number> OBI Enterprise). Use the iBots functionality to schedule reports delivery to selected users, track application usage, or trigger a request to perform analytics on data based on predefined criteria. When set up to detect specific results, iBots can also immediately send an Alert to the appropriate user through the Web, wireless, or mobile communications channels.

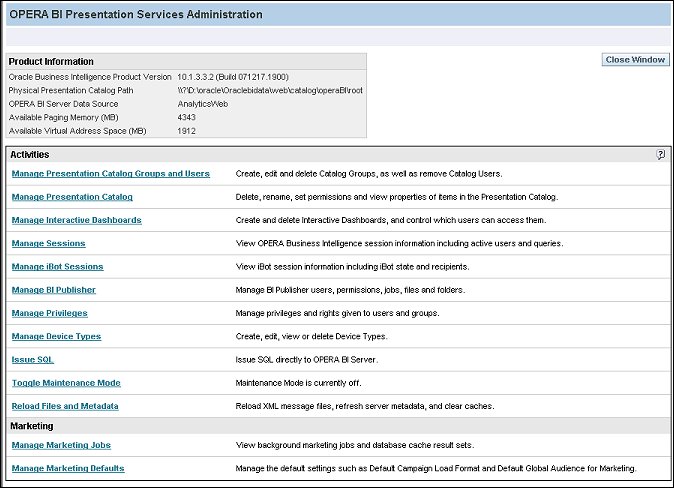
Settings - Select Administration to perform administrator duties, such as assigning specific rights to users. When selecting this option, Product Information is also displayed.

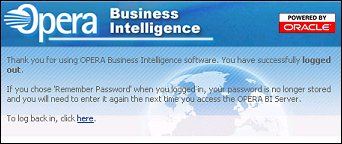
Select the Log Out option to log off BI. You will be immediately logged off. The following screen appears where you may choose to log back in.
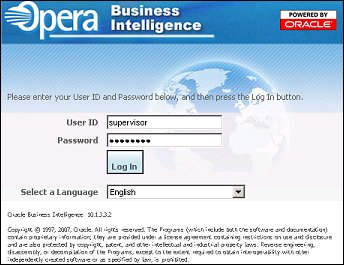
If you choose to log back in, select the click here link. The following log in screen appears. Enter your User ID and Password (and select another language, if desired) before selecting the Log In button.
See Also