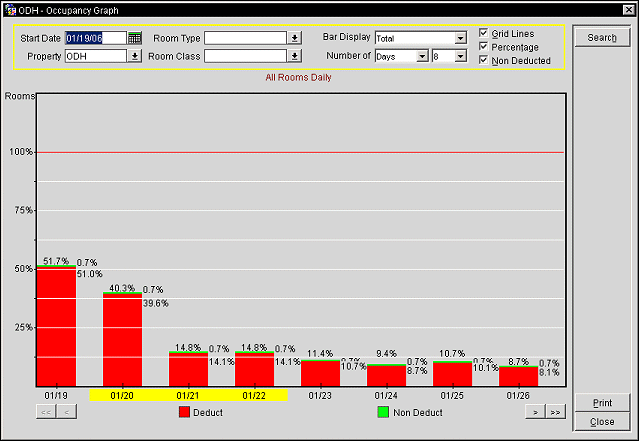
Occupancy Graph (Shift+F1)
The Occupancy Graph shows property occupancy in terms of reservations and/or blocks scheduled for a defined number of days or weeks starting with the current date or any future date. The percentages that are calculated are based upon the number of rooms to sell and this is calculated by subtracting the total number of out of order rooms from the total number of rooms. Color coding shows the components of each graph bar; percentages are also available.
A variety of sort options may be used to control the scope of the display. The Occupancy Graph may be accessed by selecting [Shift+F1] or by selecting Rooms Management > Occupancy Graph from the menu bar options.

Start Date. Enter the date from which you want the display to start. You may also use the calendar tool. The date you select cannot be previous to the current business date.
Property. Available when the OPP MHOT Multi-Property add-on license is set to Y. Select the down arrow to choose a property whose occupancy graph you want to view.
Room Type. Select the down arrow to choose the room types to be included in the display. The default is all room types.
Room Class. Available when the General>Room Class application function is set to Y. Select room classes to be included in the display. The default is all room classes. All room types in the selected room classes will automatically be entered in the Room Type field.
Bar Display. Select the down arrow to choose one of the following options to define which kinds of information to display in the Occupancy Graph. Non-deduct is included if the Non Deducted check box is selected (the default):
Total. Display the total of all deduct individual reservations and blocks in red. If the Non-Deducted check box is selected, non-deduct reservations and blocks are shown in green.
Reservations. Display deduct individual reservations in red and deduct block reservations in green.
Blocks. Display deduct picked up (blue) and not picked up (yellow) blocks. If the Non-Deducted check box is selected, non-deduct picked up is shown in red and non-deduct not-picked up is shown in green.
Non Picked Up Blocks. Display deduct non picked up blocks in yellow. If the Non-Deducted check box is selected, display non-deduct not-picked up blocks in green.
Number of Days (Weeks). Select the down arrows to choose Days or Weeks, and the number of days or weeks, depending on the display granularity you desire.
Include Non Deducted. Select this check box to include non-deducted reservations in the graph totals.
Grid Lines. Select this check box to display grid lines on the graph.
Day/Week. Select either the Day or Week option button to specify whether the graph is displayed by day or by week.
Percentage. Select this check box to display the percentage of the total number of rooms to sell that corresponds to the bar's components. When viewing by Weeks, the percentage is an average for the week. Percentages are calculated by subtracting the total number of out of order rooms from the total number of rooms.
Show Grid. Select this check box to display grid lines on the graph.
Show Percentage. Select this check box to display the daily room averages in percentage. An unselected Show Percentage check box causes the Occupancy Graph to display the next 31 days as of the entered starting date. For each date the weekday is shown. Use the cursor keys to move to single days, or one week at a time.
< << >> . Select the double arrow buttons to move to the previous or the next set of bars. Select the single arrow buttons to move to move one bar at a time.
Dates. Days of the week that have a yellow background represent weekend days as configured by the General > Weekend Days application setting.