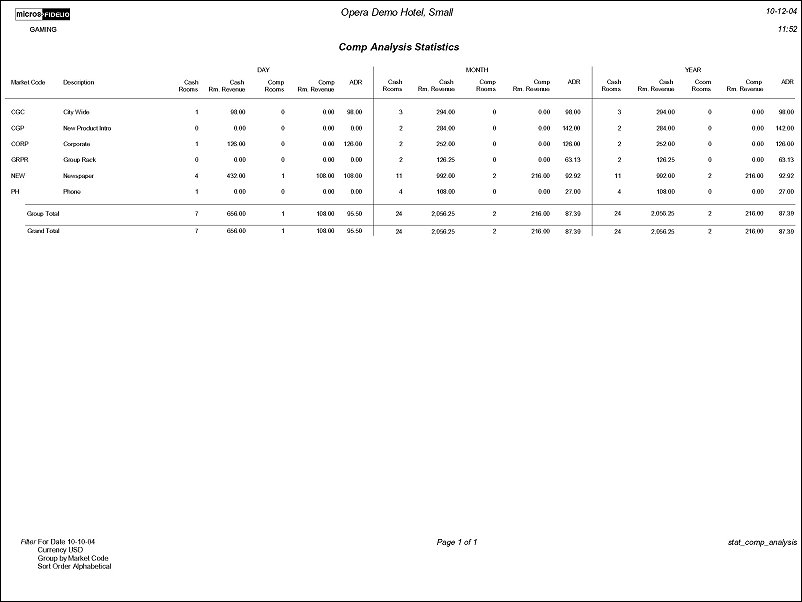
Comp Analysis Statistics (stat_comp_analysis with STA9.FMX)
This report is only available when the OPP_GCA PTS Gaming and Comp Accounting add-on license code is active.
The Comp Analysis Statistics Report displays a breakdown of Cash Rooms, Cash Room Revenue, Comp Rooms, Comp Room Revenue and the Average Daily Rate (ADR). When the report is run, the report output is divided into the three sections of Day, Month to Date, and Year to Date.
A casino property cannot consider a room night as 'Comp', unless the Room Charge is in Windows 101-108. This is regardless of the Rate Code on the Reservation. For this reason, the basis of determining if a room and Room Revenue is Cash or comp must be based on the Transaction Code and the window the posting resides in.
Definitions
Note: Once a business date is closed, a change to the allocation of whether Rooms and Revenue is Cash or comp will not be allowed. Example, If a reservation room night was on Window 1 for June 1st, once the business date had been closed in the End of Day, the room night (and revenues) will always be considered a Cash Room Night for June 1st. This is regardless if the charge is adjusted or routed to Windows 101-108, on a future date.
Posting to a transaction code, configured as Lodging in Accounts Receivable or to a Passerby account, will be included in the report for Cash Revenue under the Market Code used. With these types of postings, the number of rooms will always be zero and selecting to print the report with the Grouped By field being Room Type, the Cash Room Revenue posted in Accounts Receivable or the Passerby account will be included under No Code.
If the charges were routed from one room to another, the statistics will go to the reservation where the charges were routed to, or the guest that paid the folio.
Date. Enter a date that is less than the current business date. The report will print with the selected date, Month to Date Values as of the selected date, and the Year to Date values as of the selected date. The default date will be the current Business Date minus one.
Summary. Select to have the report output to display the Total Room Nights and Total Room Revenue, without a breakdown into the Cash and Comp segments.
Detailed. Select to have the report output display a breakdown of the Room nights and Room Revenue by Cash and Comp.
Room Class. Multi Select LOV for filtering on specific Room Classes. The Room Class filter is only displayed when the General>Room Class application function is active.
Currency Code. Multi Select LOV for filtering a specific currency codes.
Group By. Select to group the report output by either Market Code or Room Type.
Subgroup By. Select to subgroup the report output by Market Code, Room Type, or No sub group. For example, selecting to Group by Market Code, and Sub group by Room Type. The report output will display a Market Code, and under that Market Code will display each configured Room Type that has generated Room Nights or Room Revenue, with that Market Code used on the Reservation.
Sort Order. Select to sort the report output either alphabetically or by the configured sequence for the option selected in Group By. For example, selecting to Group By Market Code, should the report sort the Market Codes alphabetically or by the assigned sequence number.
Example of Scenarios for Population of cash or Comp Room Nights and Revenues
Arrival Date: March 1
Departure Date: March 4
Rate Amount: $100.00
A. At the time the reservation is made, Comp Routing is created to move all Room charges to comp window 101 for the entire stay.
|
Cash Rooms |
Cash Room Revenue |
Comp Rooms |
Comp Room Revenue |
March 1 |
|
|
1 |
$100.00 |
March 2 |
|
|
1 |
$100.00 |
March 3 |
|
|
1 |
$100.00 |
March 4 |
|
|
|
|
B. No routing is configured and the guest is charged for 3 nights. On the day of departure, the Room charges are moved to a comp window for the entire stay on March 4.
|
Cash Rooms |
Cash Room Revenue |
Comp Rooms |
Comp Room Revenue |
March 1 |
1 |
$100.00 |
|
|
March 2 |
1 |
$100.00 |
|
|
March 3 |
1 |
$100.00 |
|
|
March 4 |
-3 |
-$300.00 |
3 |
$300.00 |
C. No routing is configured and the guest is charged for 3 nights. On the day of departure, it is determined the Room charges will be comped, however, the Casino Rate Amount is at $50.00 per night. An adjustment of $150.00 is posted on Window 1 and all postings are moved to a comp window on March 4.
|
Cash Rooms |
Cash Room Revenue |
Comp Rooms |
Comp Room Revenue |
March 1 |
1 |
$100.00 |
|
|
March 2 |
1 |
$100.00 |
|
|
March 3 |
1 |
$100.00 |
|
|
March 4 |
-3 |
$-150.00 |
3 |
$150.00 |
|
-3 |
$-300.00 |
3 |
$300.00 |
